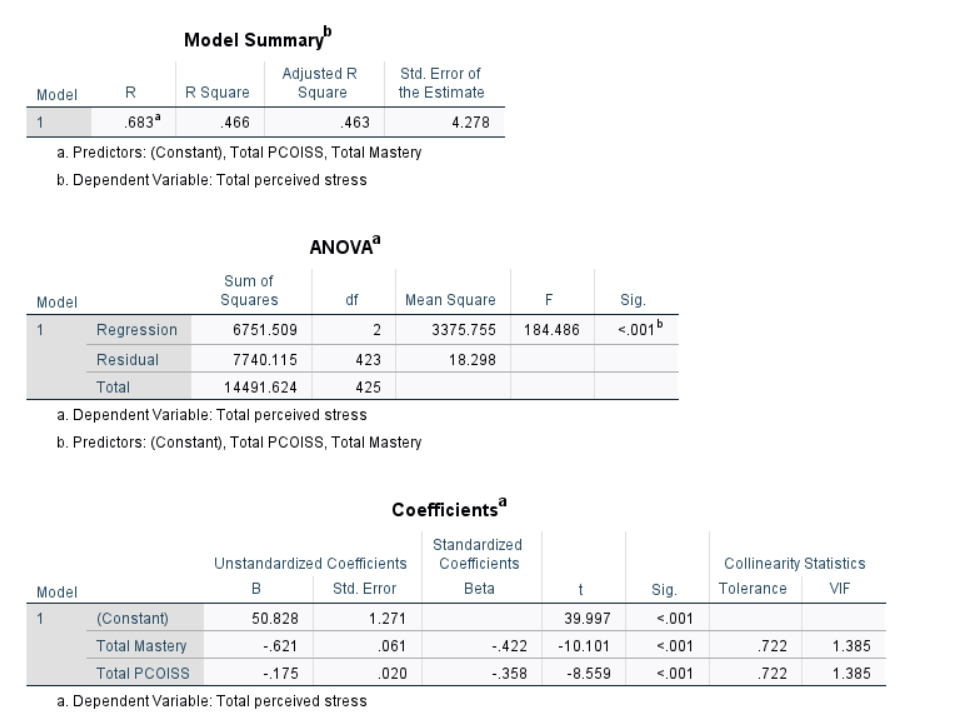
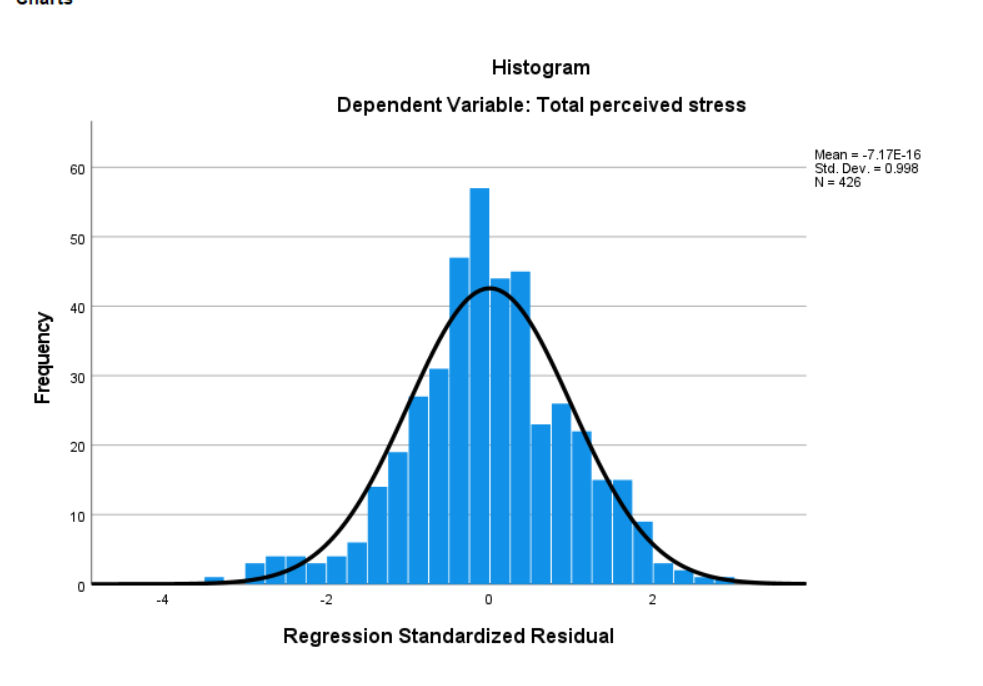
The residuals appear to be approximately normally distributed, as indicated by the bell-shaped histogram and the close alignment of points along the diagonal line...
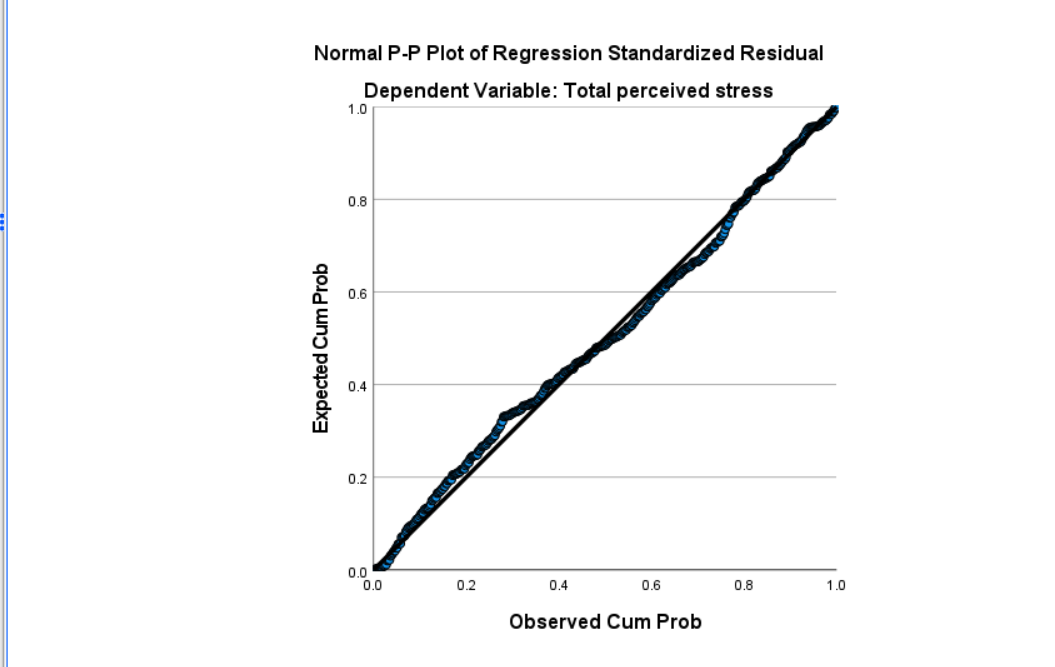
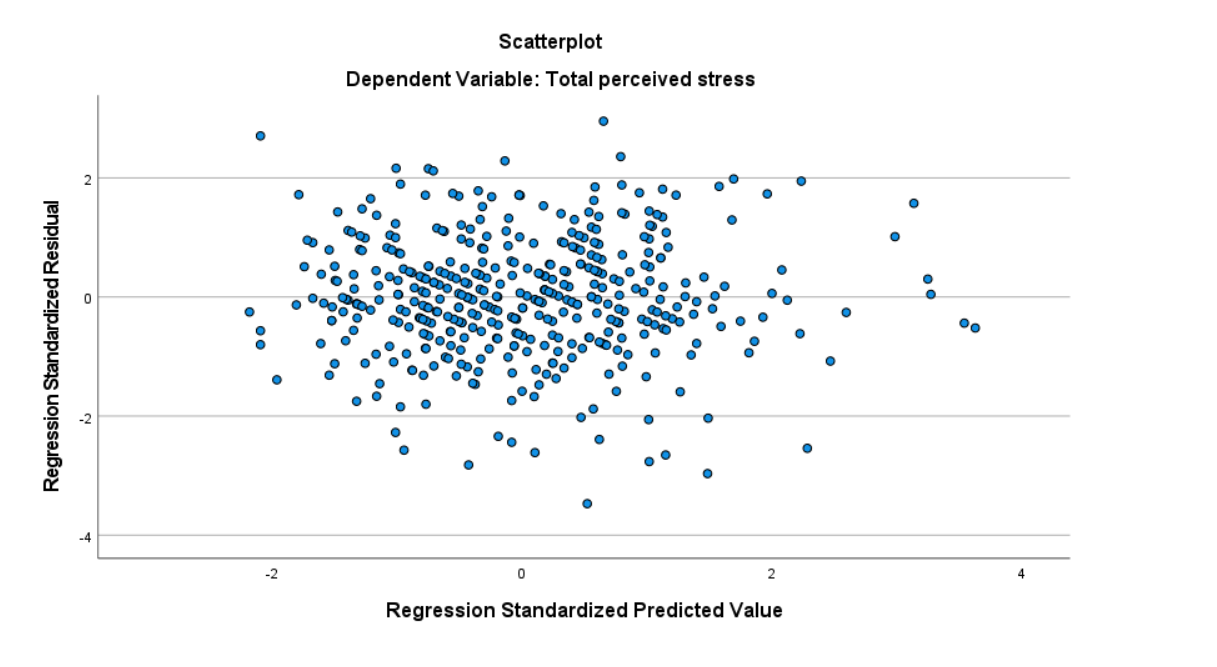
The residuals appear to be approximately normally distributed, as indicated by the bell-shaped histogram and the close alignment of points along the diagonal line in the P–P plot. The scatterplot of standardized residuals versus predicted values shows a random dispersion of points without a clear pattern, suggesting that the assumptions of linearity and homoscedasticity are met. In addition, multicollinearity does not appear to be a concern, as all VIF values are low (VIF = 1.385) and tolerance values are above the acceptable threshold (Tolerance = .722). The overall model is statistically significant (F = 184.486, p < .001) and explains a substantial proportion of variance in perceived stress (R² = .466). Therefore, the regression model can be considered appropriate and reliable for interpretation.