Regression equation:
The regression equation based on the unstandardized coefficients is:
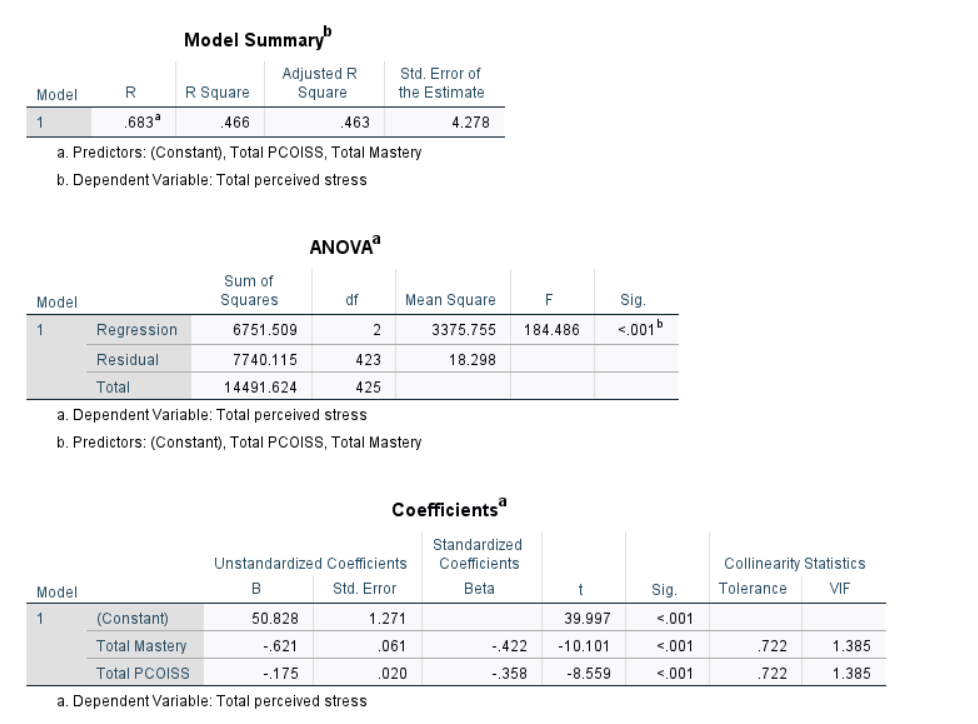
Perceived Stress = 50.828 − 0.621 (Total Mastery) − 0.175 (Total PCOISS).
Interpr...
Regression equation:
The regression equation based on the unstandardized coefficients is:
Perceived Stress = 50.828 − 0.621 (Total Mastery) − 0.175 (Total PCOISS).
Interpretation of one standardized Beta:
I think Total Mastery has a stronger effect on perceived stress because its standardized Beta (β = −.422) is larger in magnitude than that of PCOISS (β = −.358). This means that when mastery increases, perceived stress tends to decrease more noticeably compared to PCOISS.
Practical implication:
In real life, this suggests that helping students improve their sense of mastery or control over tasks may be an effective way to reduce their stress levels.