The analysis reveals a moderate negative correlation (r = -.494, p < .001) between Total Perceived Stress and Total Life Satisfaction. This suggests that higher stress ...
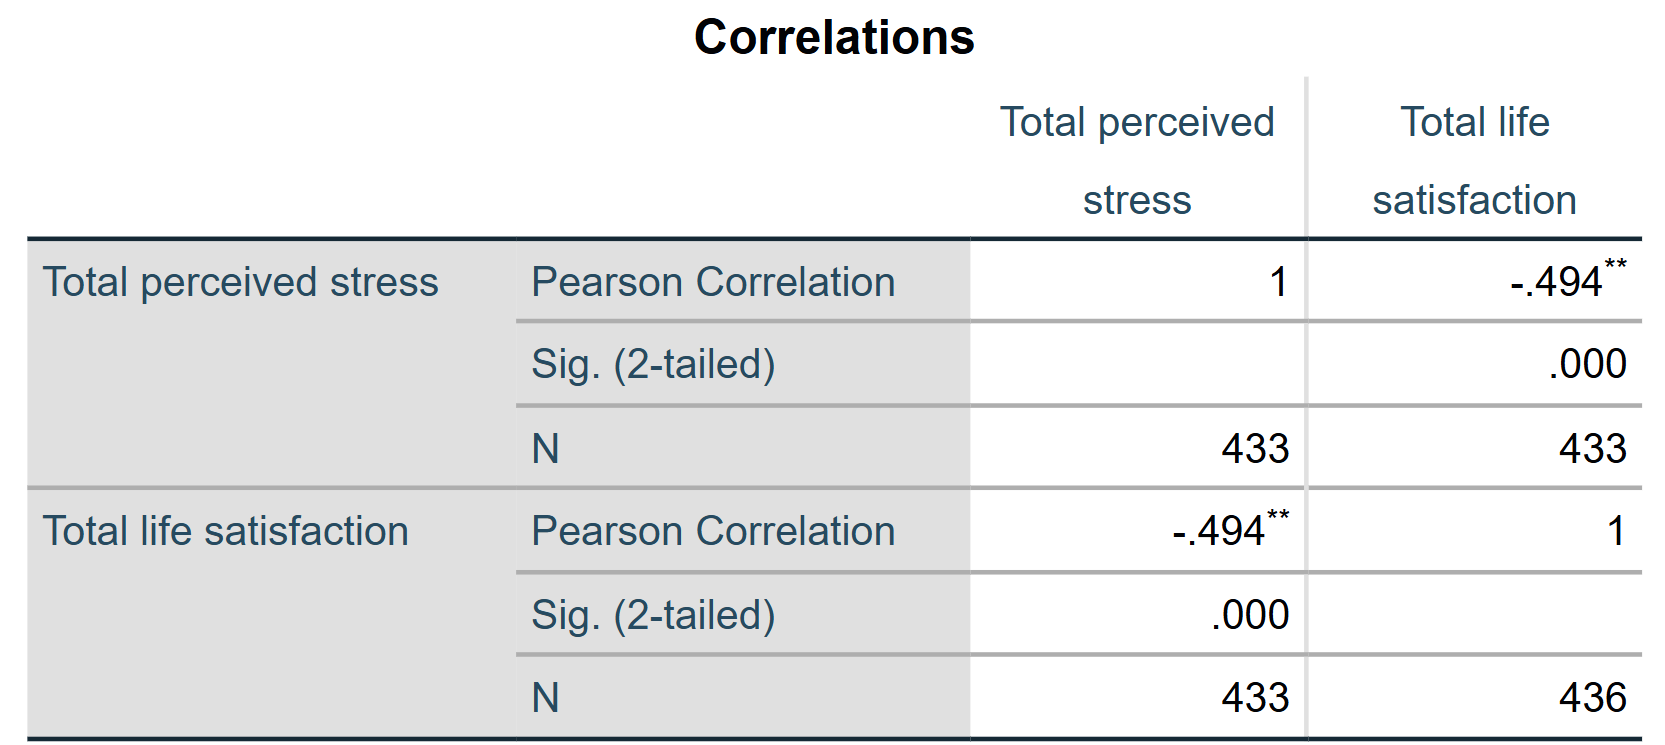
The analysis reveals a moderate negative correlation (r = -.494, p < .001) between Total Perceived Stress and Total Life Satisfaction. This suggests that higher stress levels are significantly associated with lower life satisfaction among the participants. The high statistical significance confirms that managing stress is crucial for maintaining student well-being.