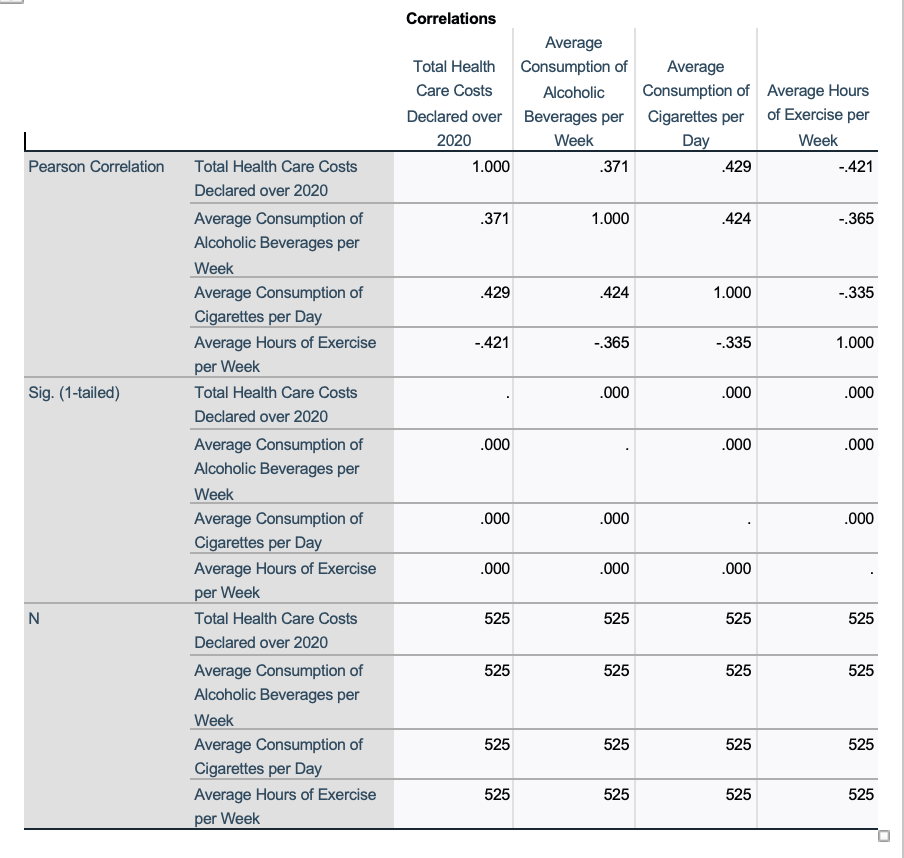
Strong correlation (r ≥ .50)
None of the correlations in your matrix reach .50, so your dataset does not contain any strong correlations.
Moderate ...
Strong correlation (r ≥ .50)
None of the correlations in your matrix reach .50, so your dataset does not contain any strong correlations.
Moderate correlation (r = .30–.49)
Total Health Care Costs ↔ Average Consumption of Cigarettes per Day
r = .429
Weak correlation (r = .10–.29)
There are no weak correlations in your matrix.
All values are ≥ .335, so all correlations fall in the moderate range.