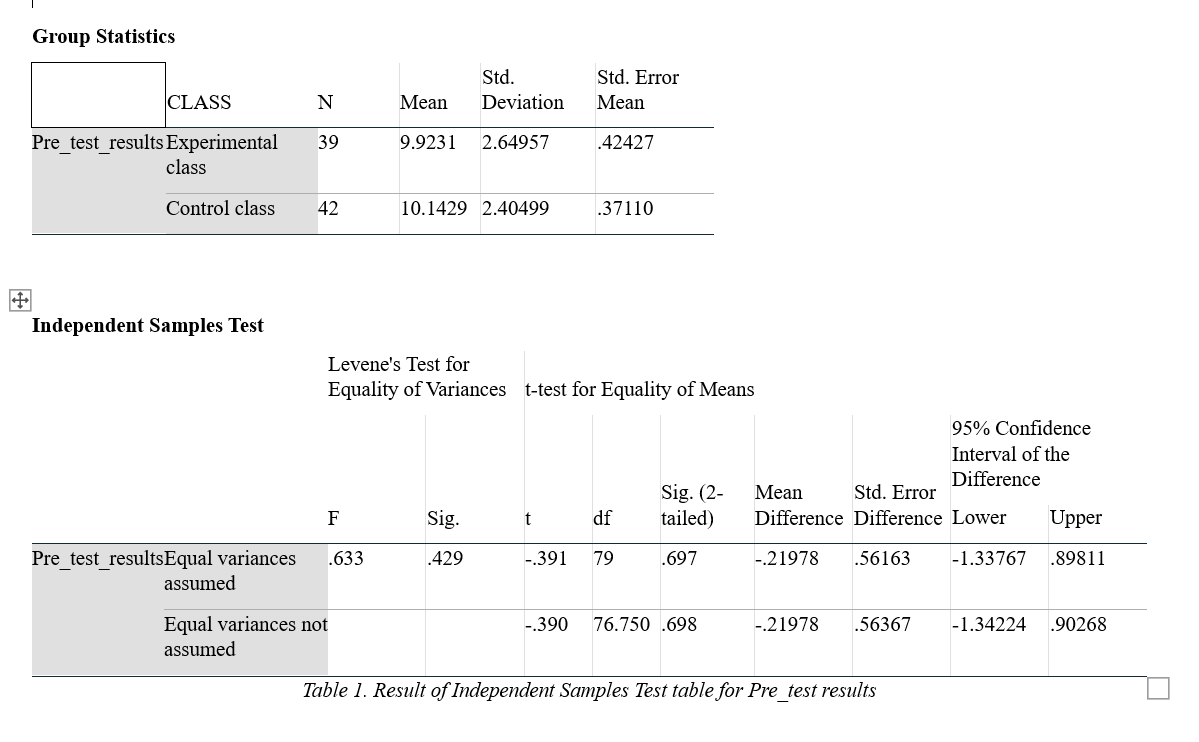
Assumption Check (Levene’s Test)
Levene’s test for equality of variances was not significant,
F = 0.633, p = .429 (> .05).
Therefore, equal variances assumed results are ...
Assumption Check (Levene’s Test)
Levene’s test for equality of variances was not significant,
F = 0.633, p = .429 (> .05).
Therefore, equal variances assumed results are used.
t-Test Results
t-value: t(79) = −0.39
p-value: p = .697 (two-tailed)
Mean difference: −0.22
95% CI: [−1.34, 0.90]
Because p > .05, the difference between groups is not statistically significant.
Effect Size (Cohen’s d)
Cohen’s d can be calculated using pooled standard deviation:
[ = \frac{M_1 - M_2}{SD_{pooled}}]
Pooled SD ≈ 2.52
[d = \frac{9.92 - 10.14}{2.52} \approx -0.09]
Cohen’s d = −0.09, indicating a very small (negligible) effect size.
An independent samples t-test indicated that there was no significant difference in pre-test scores between the experimental class (M = 9.92, SD = 2.65) and the control class (M = 10.14, SD = 2.40), t(79) = −0.39, p = .697, d = −0.09. This result suggests that the two groups had comparable ability levels before the intervention.