The Pearson correlation coefficient (r) is a core statistical tool used to assess the strength and direction of the linear relationship between two continuous variables.
📘 Definition Box
Pearson’s r measures how closely two variables move together.
Range: –1 to +1
+1 = perfect positive relationship
0 = no linear relationship
–1 = perfect negative relationship
📊 Visual 1: Example of Pearson Correlation Ranges
| Correlation (r) | Relationship Type | Scatterplot Pattern |
|---|---|---|
| +0.90 | Strong Positive | ↗ tightly clustered upward line |
| +0.30 | Weak Positive | ↗ spread but generally upward |
| 0.00 | No Correlation | •• random scatter |
| –0.50 | Moderate Negative | ↘ downward with some spread |
| –0.90 | Strong Negative | ↘ tightly clustered downward line |
🖼️ [Insert 5 mini scatterplot images corresponding to each row above]
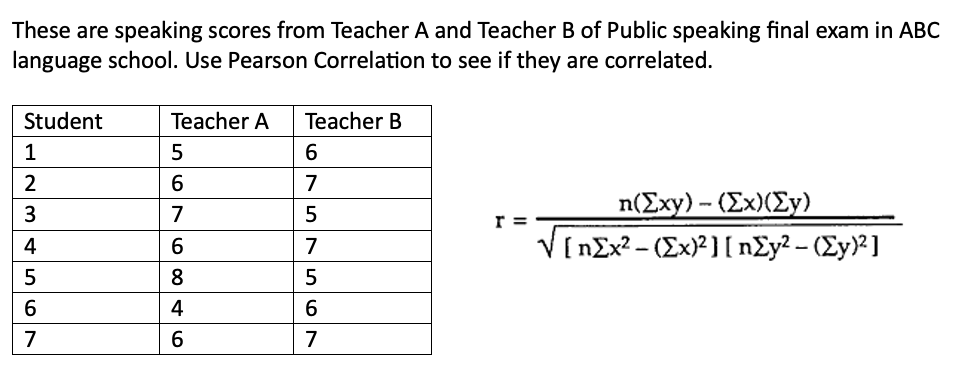
📐 Formula for Pearson Correlation (for reference)
Where:
-
X,Y: observed values of variables
-
Xˉ,Yˉ: means of variables
🧪 When to Use Pearson Correlation
Use Pearson's only when:
-
Both variables are interval or ratio scale
-
Data is normally distributed
-
Relationship is linear
⚠️ For ordinal data, use Spearman’s rho instead.
🔍 Role in Validity Testing
Pearson correlation is particularly important in construct validity analysis:
| Type of Validity | Role of Correlation |
|---|---|
| Convergent validity | Items or scales measuring the same construct should have high r |
| Discriminant validity | Items or constructs should not be too highly correlated (low-to-moderate r) |
📌 Example: If Satisfaction and Service Quality both correlate at r = 0.85, this could indicate poor discriminant validity — they may be measuring the same thing.
🖥️ SPSS Tip Box
🧩 In SPSS, go to:
Analyze → Correlate → Bivariate → Pearson
→ Check “Pearson” and “2-tailed” options
→ Output gives r values, sig. (p) values for hypothesis testing
🧪 Rule of thumb:
If p < .05 → the correlation is statistically significant.
🧠 Remember: Correlation ≠ Causation
Even if r = 0.90, it does not mean one variable causes the other.
They may be both influenced by a third factor.
📌 Quick Summary Box
| Concept | Description |
|---|---|
| Pearson r | Strength/direction of linear relationship |
| Range | –1 to +1 |
| High r (same construct) | Good convergent validity |
| Low r (diff constructs) | Good discriminant validity |
| Significance | p < .05 means r is statistically significant |
| Misuse warning | Don’t confuse correlation with causation |
Exercise