📑 Report 1 – Testing Regression Assumptions
The dataset utilized in this analysis comprised 525 cases, with total health care costs designated as the dependent variable and three predictors entered into the model: alcohol consumption (alco), cigarette use (cigs), and exercise frequency (exer). Prior to interpreting the regression coefficients, the classical assumptions of linear regression were examined to ensure model validity.
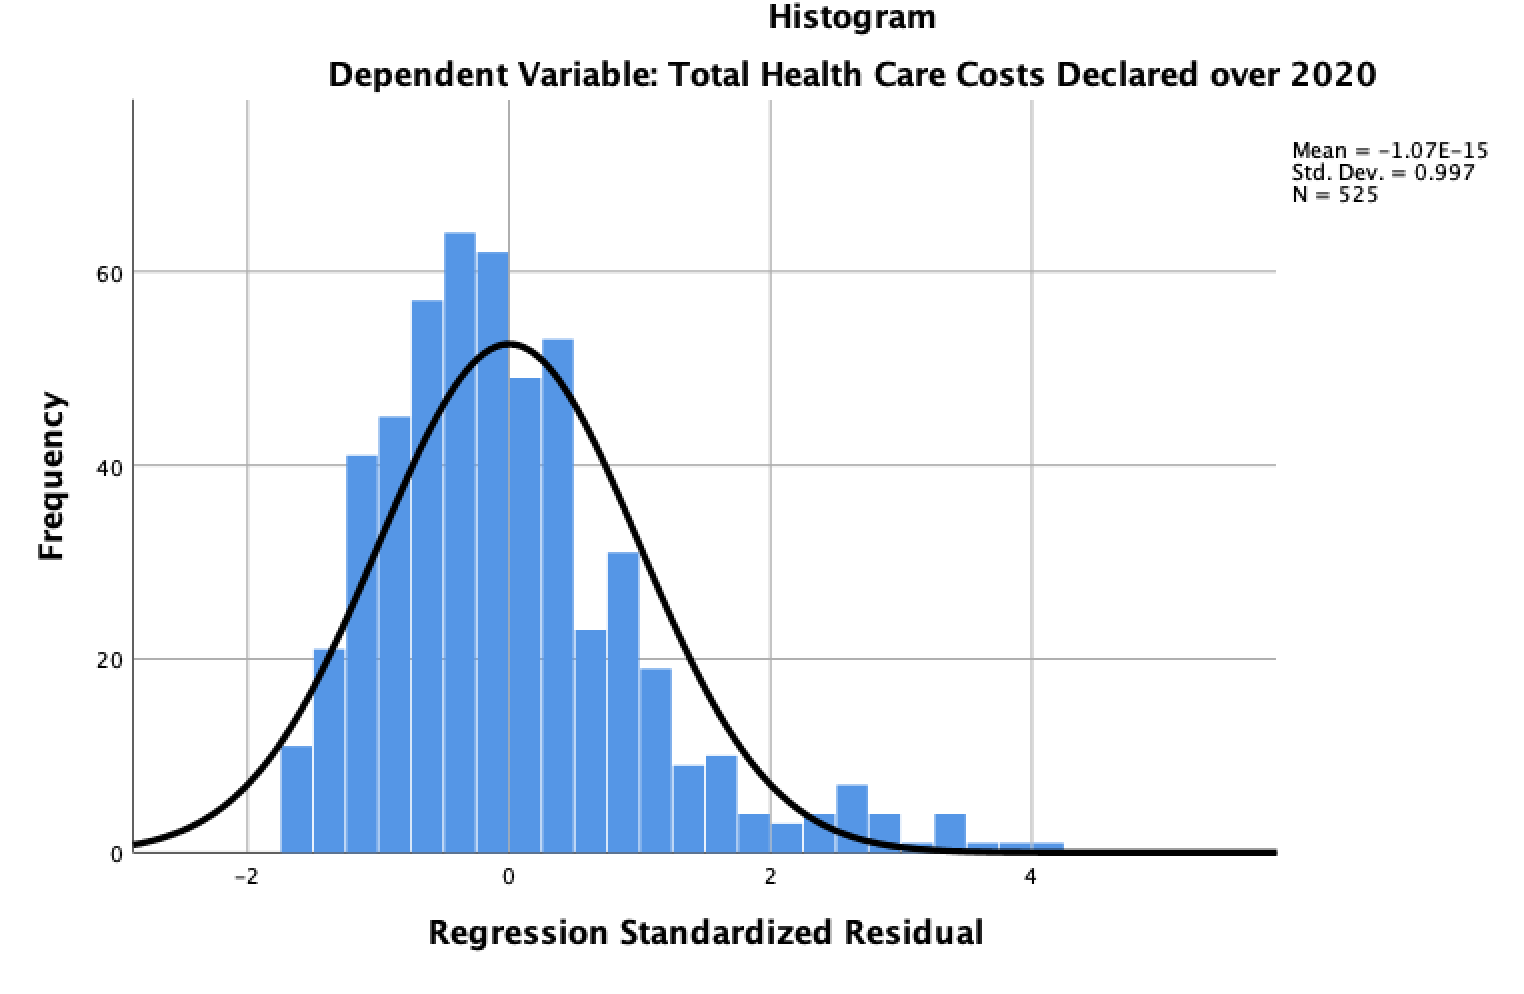
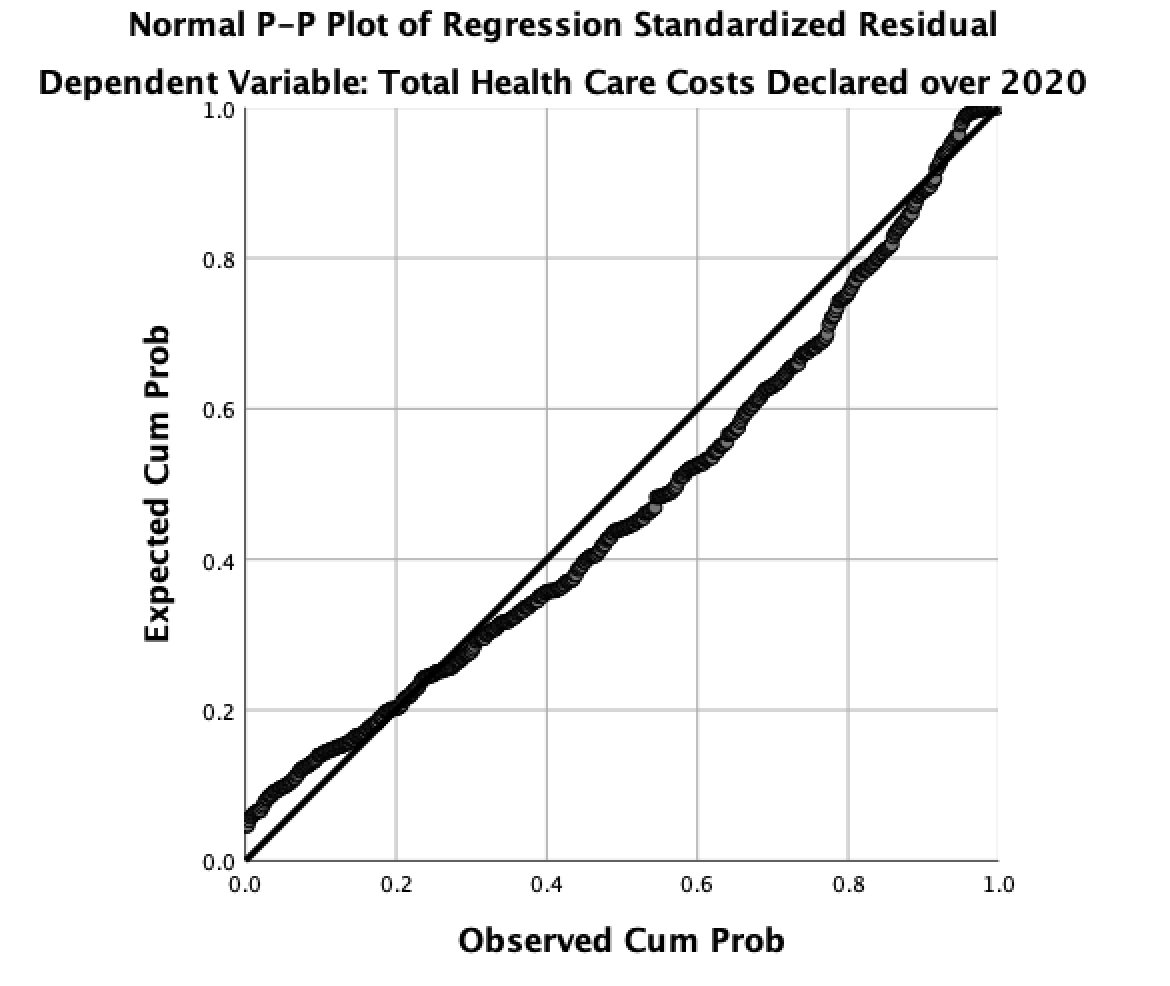
Normality: The histogram of standardized residuals approximated a normal distribution, and the Normal P–P plot displayed points closely aligned with the diagonal reference line. These results suggest that the normality assumption was satisfied.
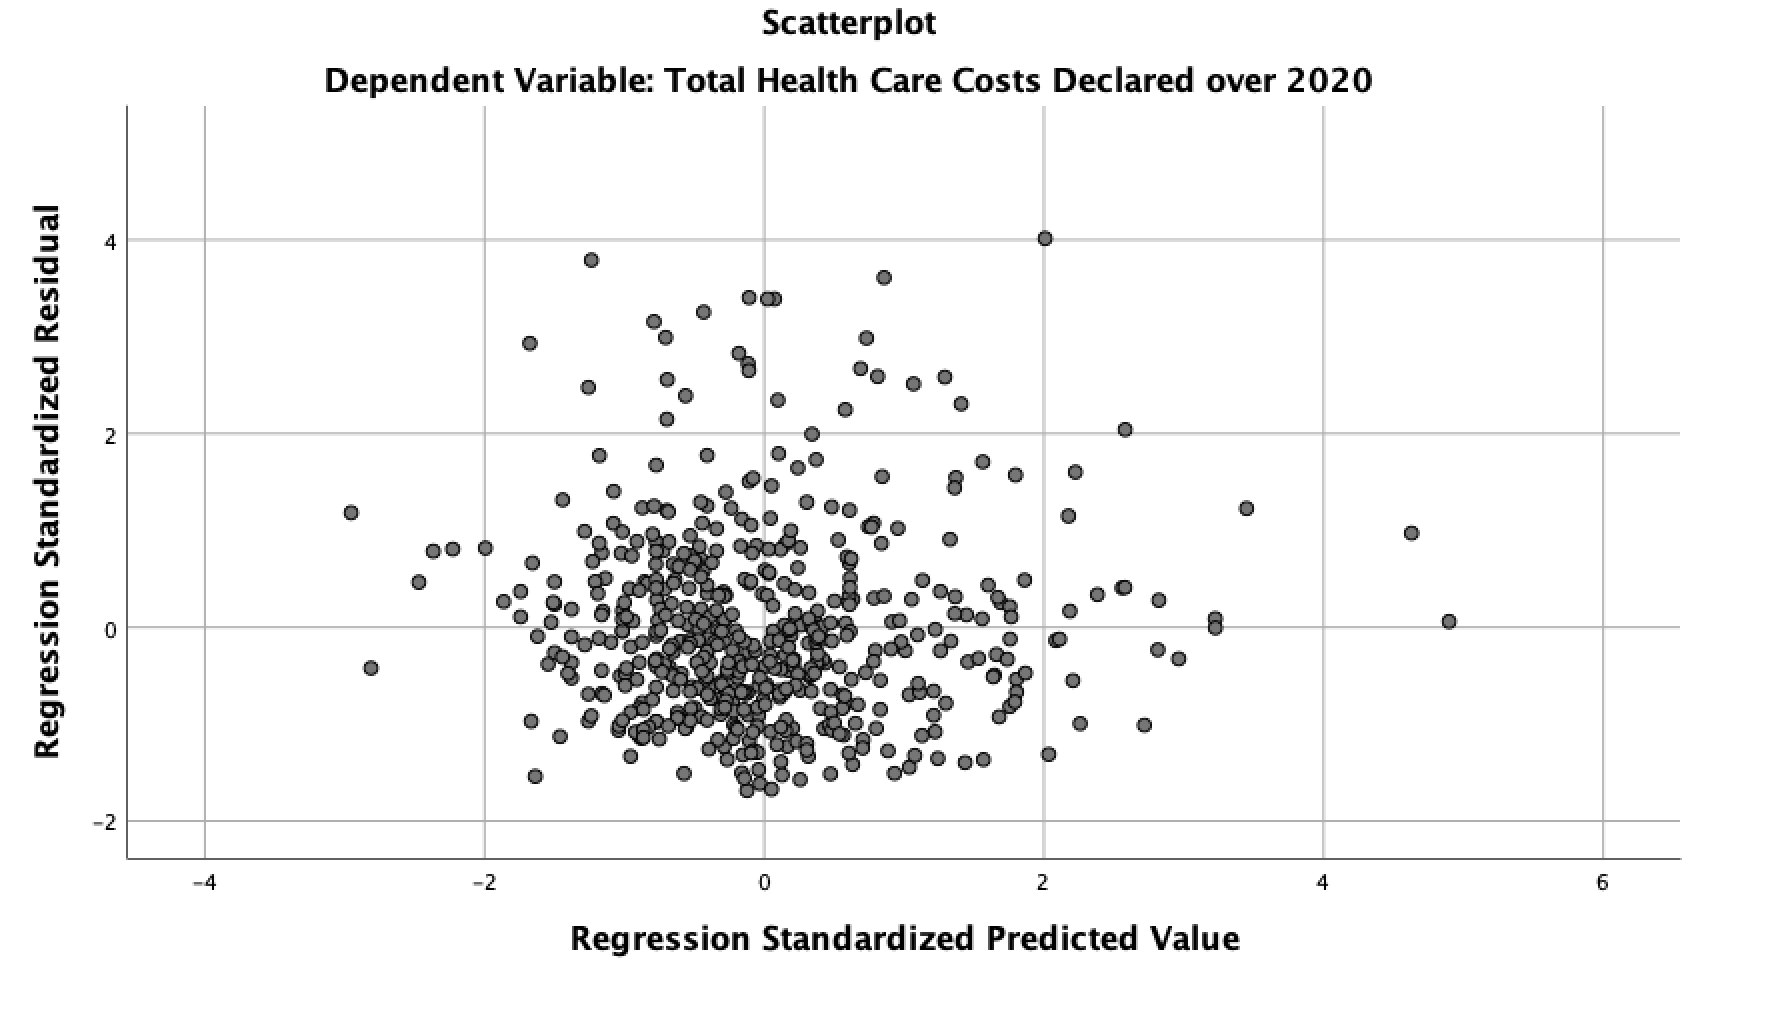
Linearity & Homoscedasticity: The scatterplot of standardized residuals (ZRESID) against predicted values (ZPRED) demonstrated no curvilinear pattern and constant variance, indicating both assumptions were upheld.
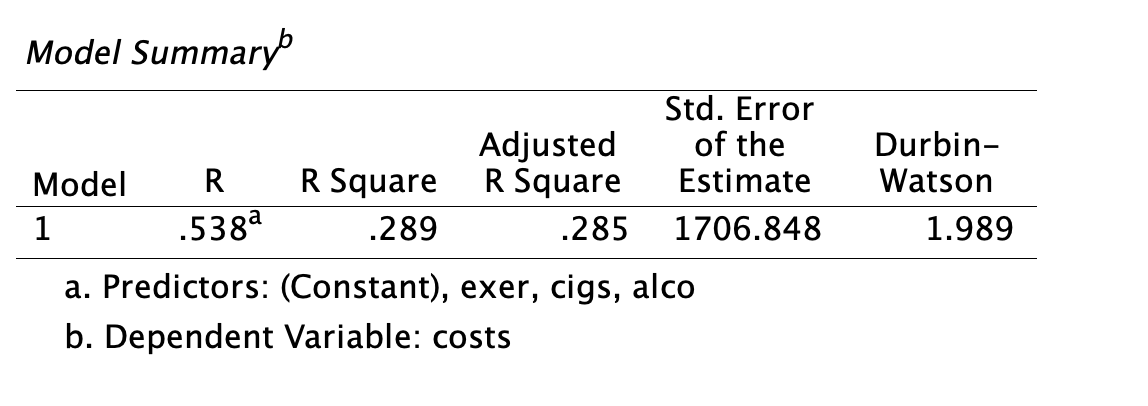
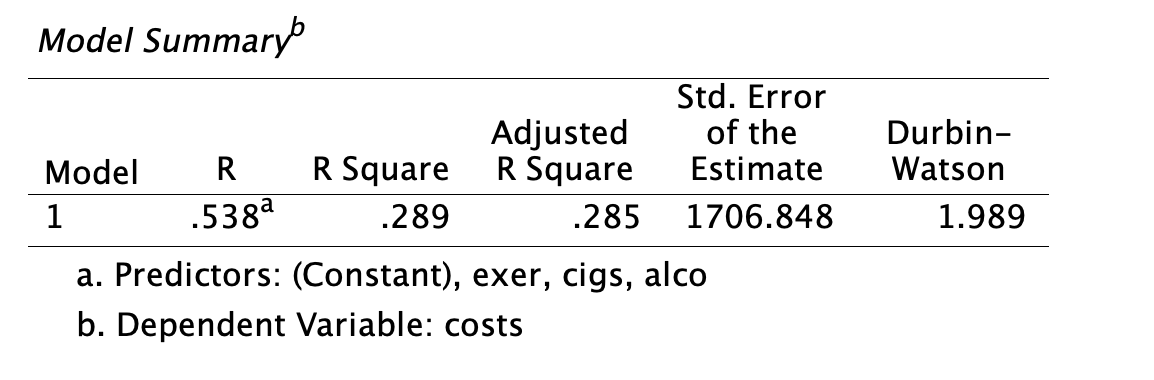
Independence: The Durbin–Watson statistic was 1.989, close to the ideal value of 2.0, suggesting no evidence of autocorrelation among residuals.
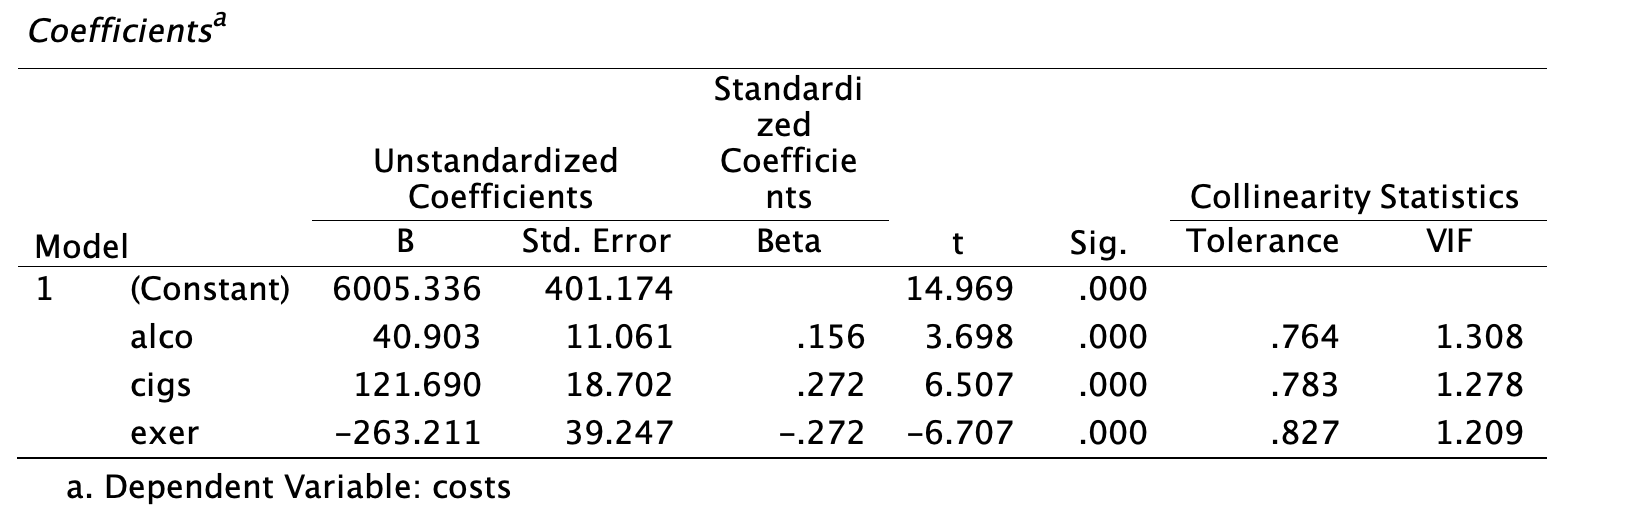
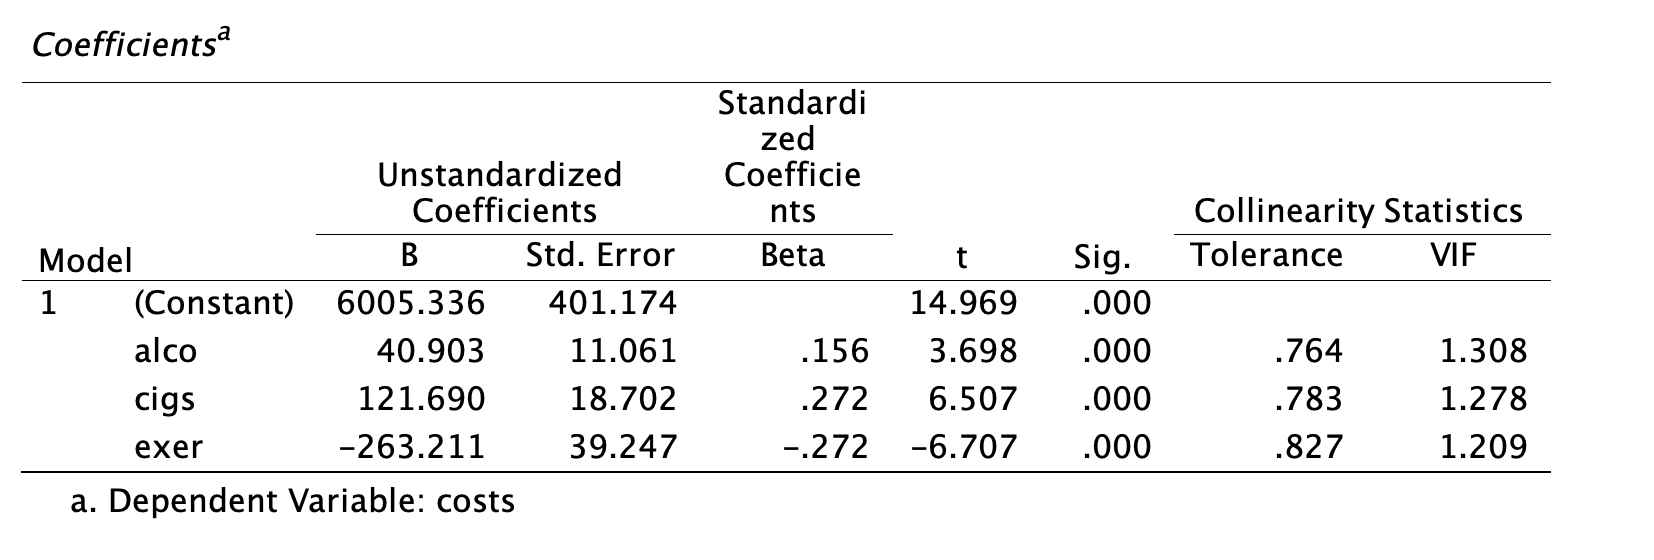
Multicollinearity: Tolerance values ranged from .764 to .827, with all VIF values below 2. These results confirm that multicollinearity was not a concern.
In summary, the diagnostic analyses confirm that the regression model met the principal assumptions of linear regression, thereby permitting valid interpretation of the model coefficients.
📑 Report 2 – Interpreting SPSS Regression Output
The multiple regression analysis sought to predict total health care costs from alcohol consumption, cigarette use, and exercise frequency. The results of the model summary, ANOVA, and coefficients tables are presented below.
Model Summary: The regression model explained approximately 28.9% of the variance in health care costs (R² = .289, Adjusted R² = .285). The standard error of the estimate was 1,706.85, indicating moderate dispersion of predicted values.
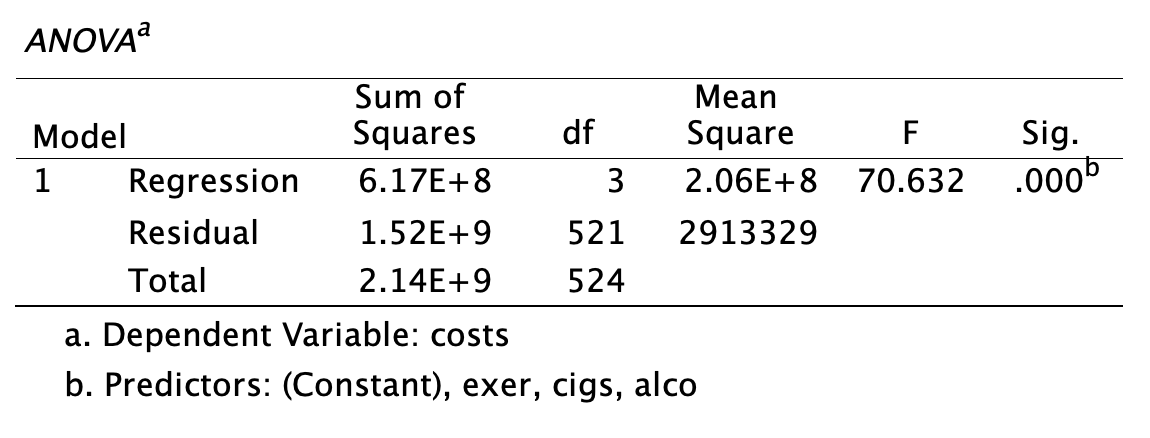
ANOVA: The overall model was statistically significant, F(3, 521) = 70.63, p < .001, confirming that the predictors collectively contributed to explaining variance in health care costs.
Coefficients:
- Alcohol (alco): B = 40.90, β = .156, p < .001 → Each additional unit of alcohol intake was associated with a cost increase of approximately $40.90.
- Cigarettes (cigs): B = 121.69, β = .272, p < .001 → The strongest positive predictor; each additional cigarette per day increased costs by $121.69.
- Exercise (exer): B = –263.21, β = –.272, p < .001 → A protective factor; each additional unit of exercise reduced costs by approximately $263.21.
Regression Equation:
Costs = 6005.34 + 40.90(alco) + 121.69(cigs) – 263.21(exer) + ε
In practical terms, the findings highlight that unhealthy lifestyle behaviors, such as alcohol consumption and cigarette smoking, substantially elevate health care costs, whereas regular exercise significantly reduces such costs. These results emphasize both the economic and health benefits of preventive health behaviors.