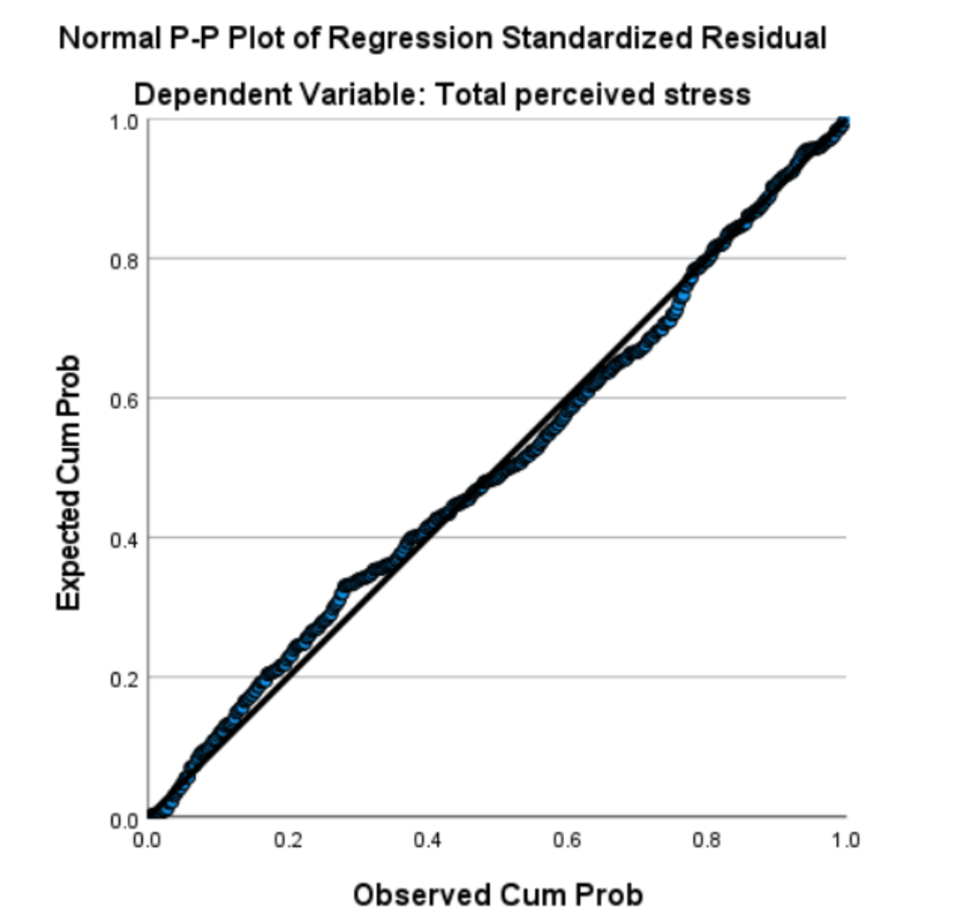
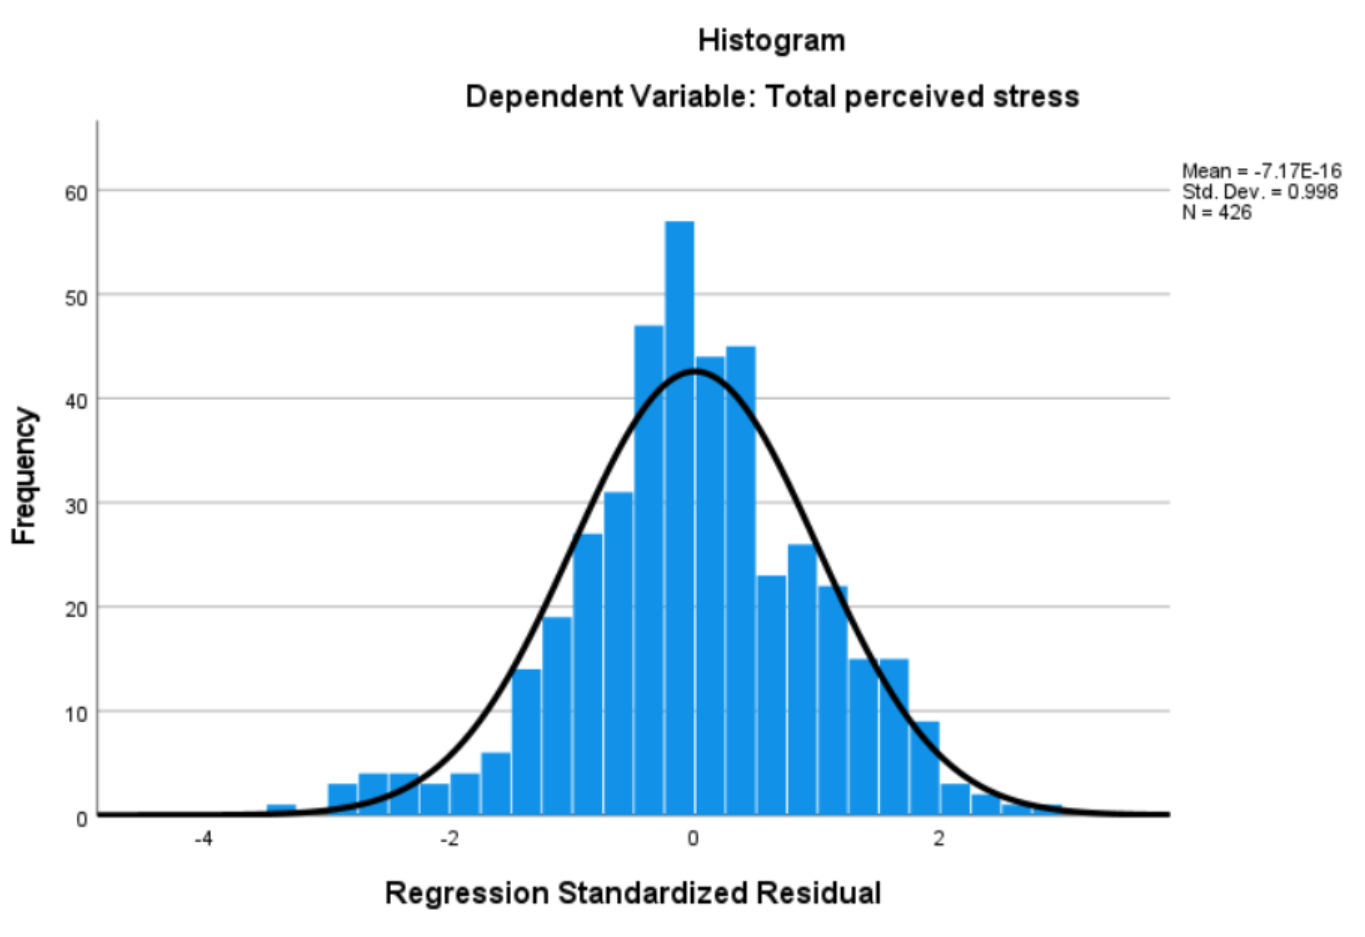
Our data meets the necessary standards for a good regression. The histogram looks like a bell and the P–P plot follows a clear diagonal line, meaning the residuals are ...
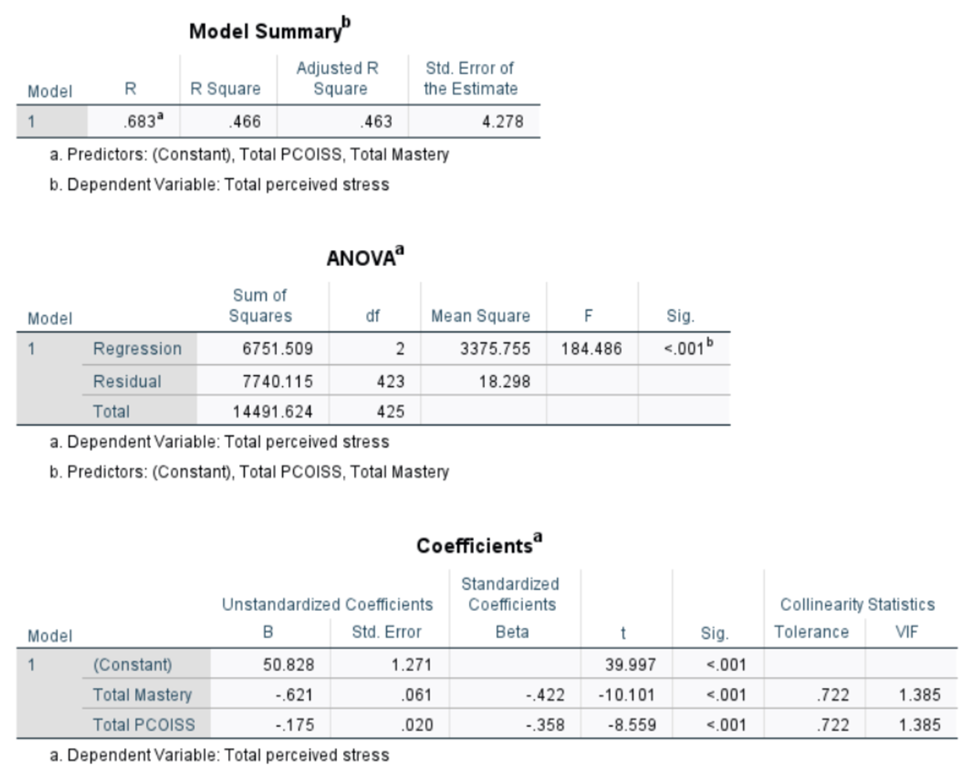
Our data meets the necessary standards for a good regression. The histogram looks like a bell and the P–P plot follows a clear diagonal line, meaning the residuals are normally distributed. Also, because the scatterplot shows a random mix of points, we can trust that the model is linear and steady. We don't have to worry about variables interfering with each other because the VIF (1.385) and tolerance (.722) are well within the healthy range. The model is statistically significant (F = 184.486, p < .001) and accounts for a large part of the variance in stress (R² = .466).